Table of Contents
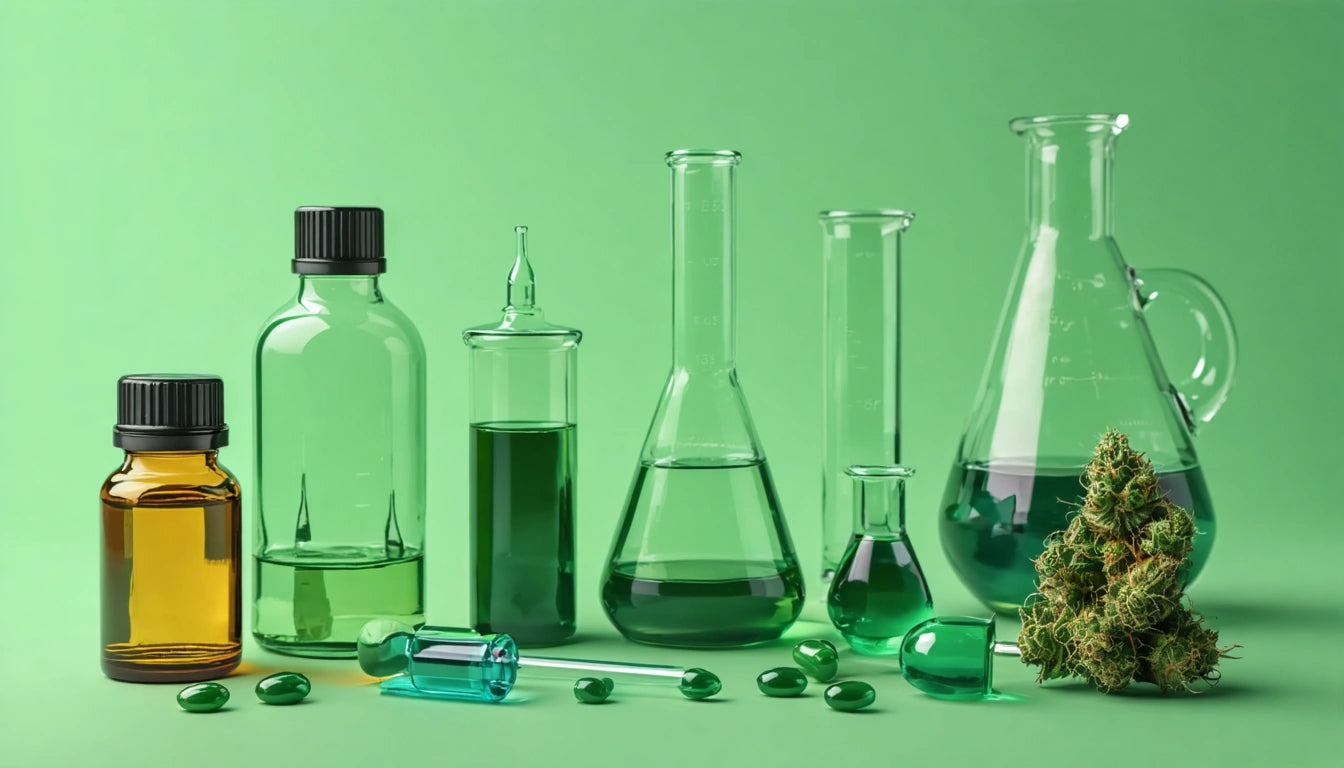
Cannabis product labels display percentages of cannabinoids and terpenes that can significantly influence consumer experience. Understanding these numbers helps consumers and industry professionals make informed decisions about product selection, dosing, and expected effects. This guide explains how to interpret these crucial metrics.
Understanding Cannabinoid Percentages
Cannabinoid percentages represent the concentration of active compounds in cannabis products. These numbers typically indicate the weight percentage of the compound relative to the total product weight. For flower products, THC percentages commonly range from 15% to 30%, while CBD-dominant strains might contain 5% to 20% CBD with minimal THC.
When examining a Certificate of Analysis (COA), you'll notice several cannabinoid measurements. The most important distinction is between total potential cannabinoids and activated cannabinoids. For example, THCA converts to THC when heated (decarboxylated), which occurs during smoking or vaping.
THC Potency Interpretation
THC percentages directly correlate with potency, but the relationship isn't always linear in terms of effects. A 25% THC strain isn't necessarily twice as potent as a 12.5% strain in subjective experience. Other factors, including terpenes, minor cannabinoids, and individual biology, influence the overall effect.
When interpreting THC levels:
- 15% or below: Generally considered mild to moderate potency
- 15-20%: Medium potency, suitable for regular consumers
- 20-25%: High potency, potentially overwhelming for novices
- 25%+: Very high potency, approach with caution
According to potency testing standards, variations of ±3% are common between different testing labs, which explains why the same product might show different THC percentages depending on where it was tested.
CBD Percentages and Ratios
CBD percentages are particularly important for medical users and those seeking non-intoxicating benefits. The ratio of CBD to THC significantly influences the experience:
- 1:1 ratio: Balanced effects with moderated psychoactivity
- 2:1 or 3:1 (CBD:THC): Mild psychoactivity with pronounced therapeutic potential
- 10:1 or higher: Minimal intoxication with CBD-dominant effects
CBD can modulate THC's effects, potentially reducing anxiety or paranoia sometimes associated with high-THC products. This interaction, known as the "entourage effect," highlights why percentages alone don't tell the complete story.
Terpene Profiles Explained
Terpenes are aromatic compounds that contribute to cannabis flavor and effects. Unlike cannabinoids, terpene percentages are typically much lower, usually between 0.1% and 3% total. Even at these concentrations, they significantly influence the experience.
Common terpenes and their typical effects include:
- Myrcene: Sedative, relaxing (found in indica-dominant strains)
- Limonene: Uplifting, mood-enhancing (citrus scented)
- Pinene: Alert, clear-headed (pine scented)
- Caryophyllene: Anti-inflammatory, stress-relieving (peppery)
- Linalool: Calming, anxiety-reducing (floral)
To preserve these delicate compounds, proper storage is essential. Using humidity control packs in your storage containers can help maintain optimal moisture levels that preserve terpene integrity and prevent degradation of both terpenes and cannabinoids.
Lab Testing Variations
Understanding lab testing methodology helps contextualize percentage variations. Batch testing versus product testing can yield different results, even for the same strain. Batch testing examines representative samples from a larger harvest, while product testing analyzes the specific packaged product.
Several factors contribute to testing variations:
- Sampling methods (which parts of the plant are tested)
- Laboratory equipment calibration
- Testing methodologies (HPLC vs. GC)
- Moisture content at time of testing
These variations explain why third-party testing is becoming the industry standard for transparency and accuracy. Independent labs provide unbiased results that consumers can trust more than in-house testing.
Practical Applications for Consumers
Interpreting cannabinoid and terpene percentages helps consumers make informed choices. When reviewing product labels or COAs:
- Consider your tolerance and experience level relative to THC percentages
- Look beyond THC to the CBD content and ratio
- Pay attention to dominant terpenes for effect prediction
- Check testing dates, as cannabinoids degrade over time
- Compare similar products across brands using percentage data
Lab results can also inform product recommendations for specific needs. For example, high-myrcene products may better serve sleep issues, while limonene-rich varieties might benefit mood disorders.
Remember that testing requirements vary by state, affecting what information appears on labels. Some jurisdictions require comprehensive terpene testing, while others focus primarily on cannabinoid content and contaminant screening.
By understanding these numbers in context, both consumers and industry professionals can better predict effects, ensure consistency, and make more satisfying product selections based on scientific data rather than strain names or marketing alone.




Leave a comment
All comments are moderated before being published.
This site is protected by hCaptcha and the hCaptcha Privacy Policy and Terms of Service apply.